Your SLA Metric Is Probably Costing You Money

Welcome guest contributor Jeremy Markey and coauthor Nathan Knight! Jeremy and Nathan each have a decades-long background in contact centers and share from their experience working with agents on the Workforce Engagement Team at Hunter Douglas, the leading manufacturer and marketer of custom window treatments in North America.
If your service level target is 80/20, 80/30, or your average speed of answer target is 30 seconds, I’m willing to wager it’s costing you money.
The purpose of service level or average speed of answer is to contain costs by delivering service that is as close to disrupting the customer experience without going over the line. Disney may be the best example of this. My wife and I spent a day at Disneyland, without our kids (highly recommended!). While in line for nearly two hours, surrounded by families with at least two dozen kids, not one kid lost their mind, complained, cried, or was looking at a phone or tablet. They, like my wife and I, were excitedly waiting to start the Star Wars Rise of the Resistance ride. Clearly Disney did not need to get us moving through the line faster; we were satisfied with our experience. And the ride was amazing!
Back in 1998 Disney saw between a 4% and 10% decline in park attendance across all the US-based parks. The message was clear: guests were unsatisfied with how long they were waiting in line. Yet our wait this summer was quite lengthy… how did Disney solve the problem then? Most of us would jump to the conclusion that they added more rides or shortened the rides to allow them to get more people through in a given amount of time.
Adding more rides, more theme parks, or altering rides would have been expensive solutions that would take a long time to implement. Instead, in 1999 they experimented with their first ever Fast Pass on the iconic Space Mountain ride. Not only did dissatisfaction dissipate, guests spent more time in the theme park, spent more money on food and gifts, and spent more time riding the other less popular rides. Anyone who has spent time at Disney knows the best way to experience Disney is to optimize your use of Fast Pass.
Bottom line, Disney didn’t take the normal approach we do in contact centers, which is to add more capacity or people. We’re all so afraid of poor VoC or escalations due to wait times that we’ve set “headache free” expectations for our service levels, because we “know” at these levels no one will complain. The problem is without doing the leg work, we often overshoot that goal and end up spending more money than needed. It would be like if in 1998 Disney decided to add a full-sized theme park to every major US city. If you look into the history of Six Flags, you’ll know that would have been a devastating decision for Disney to make.
We outline below a method for you to identify what a proper service level should be for your organization. With this method, you can work down the right path to being at the right size and giving the right level of service for your customers or consumers.
We used this method at Hunter Douglas, saving seven full-time equivalents (FTE) while maintaining performance in all other metrics that matter, except VoC, which improved by 6 points to nearly our highest VoC to date. Our initial service level metric was 80/30. Today our average speed of answer metric is one to two minutes. Less than one minute and we’re over-servicing, greater than two minutes and we’re under-servicing.
Metrics to Pull:
I can only guess what Disney is using as metrics to determine success. For our customer experience centers, here are metrics we should use. Your list will be similar, if not identical.
- Service Metrics:
- Service Level or Average Speed of Answer (or both)
- Experience Metrics:
- Abandon Rate
- First Call Resolution or Recontact Rate
- CSAT/VOC/NPS/Ease of Doing Business
- Transfer Rate
Finding the Tipping Point:
You’ll want a long enough time period, at a granular enough detail, to see the tipping point between your service metric and your experience metrics. At Hunter Douglas, we pulled six months of data at one-hour intervals using the above metrics.
We didn’t look at the data in chronological order. Instead, we lumped service metrics into buckets and then aligned experience metrics at that time. For example, the average speed of answer buckets we used were 0–60 seconds, 1–2 minutes, 2–3 minutes, 3–4 minutes, and 4+ minutes.
In each service metric bucket, you align what your experience metrics were, and, if you pulled the right data into the right buckets, the tipping point will emerge. The first time we did this experiment, no correlation was made, because our service metric was so low that we hadn’t crossed the tipping point yet. If your service metric is pretty good, chances are you will need to experience much worse service metrics to get the data you need. I’m sure it’ll be no problem convincing people to let you do that 🙂
We found our experience metrics didn’t start to fall outside of our goals until our average speed of answer rose above three minutes. As we at Hunter Douglas provide top-notch service, we selected a one to two minute speed of answer as our target, giving us plenty of room to slip before our experience metrics take a hit.
Had we pushed our average speed of answer target all the way to the edge of three minutes, we would have further reduced our required FTE by 18 instead of the reduction of 7 FTE mentioned above.
Tipping Point Examples:
You’re looking for results that indicate customer frustration. A reduction in first contact resolution, reduction in voice of the customer or similar metric, and an increase in transfer rate between departments are all examples of frustrated customers.
Abandon Rate & First Call Resolution:
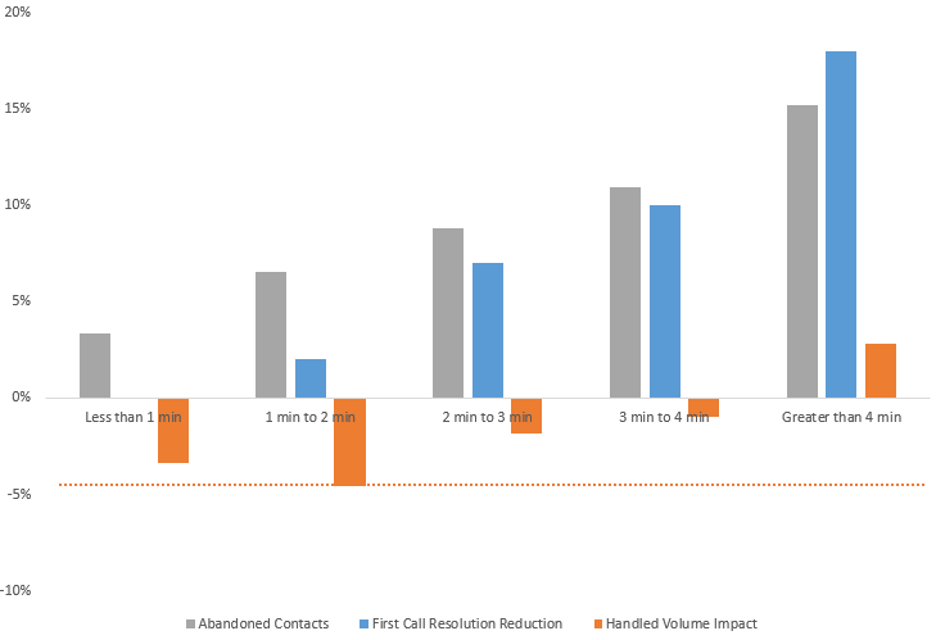
- We’re looking for the ASA bucket with the greatest reduction of contact volume.
- In a service department, contacts that abandon and do not contact back are not a bad thing. The assumption is the customer used self-service to resolve their needs. Your VOC score will indicate if this assumption is likely true.
- We saw the most significant volume impact by handling contacts between 1 and 2 minutes ASA, where our abandon rate increase outpaced our FCR reduction and we saw a handled volume reduction of nearly 5%.
- As you can see by the graph below, this is our first indication of a tipping point.
Voice of the Customer:
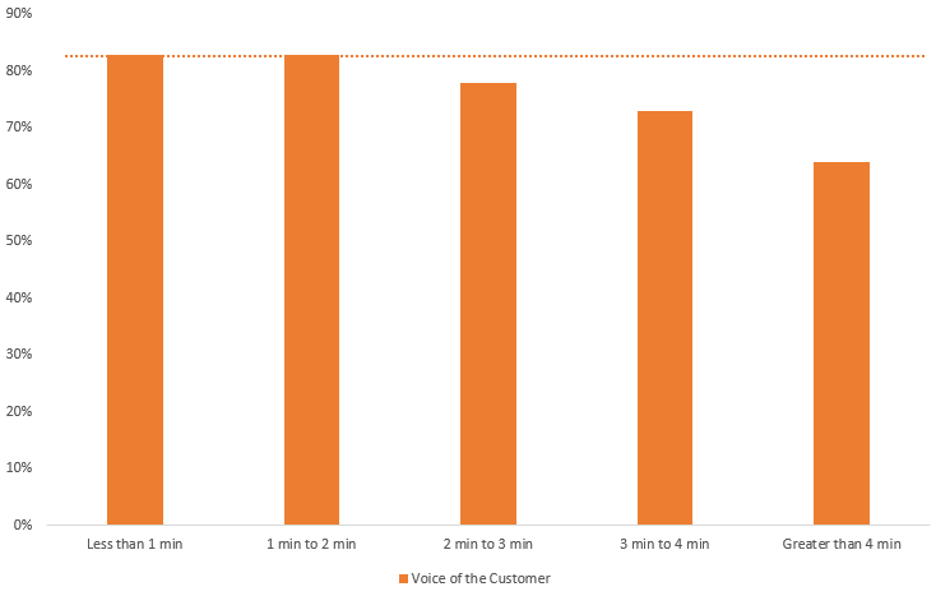
- We’re looking for the ASA buckets where VOC remains within goal.
- Reductions in VOC are a clear indicator of customer frustration. You can get more granular and look at specific questions, like ease of doing business, to find patterns.
- Our Voice of the Customer from 0 min ASA to 2 min ASA was identical. As we crossed 2 min ASA, we saw our first impact but remained within goal.
Transfer Rate:
- We’re looking for the ASA bucket before the transfer rate begins to escalate.
- Increased transfers between departments is a measure of frustration, as customers are either IVR shopping, looking for the fastest way to get help, or asking every possible question under the sun so they don’t have to call back.
- For exhaustive questions, you’ll also see an increase in talk time, which we did not see.
- The tipping point of 3 minutes aligns here.
- Note: At Hunter Douglas, we have a high transfer rate compared to many industries. As we’re business to business, our customers are dealers who frequently call regarding multiple consumers or have consumer orders across several product lines. The complexity of our business currently necessitates speaking to multiple departments.
Lessons Learned:
There is No Industry Standard: Each organization’s customers, experience, product offering, value proposition, and so on are unique. As a product of that uniqueness, what our customers are willing to experience before getting frustrated is different. The correct way to know what is right for your organization is to sample real data and do the above work.
Original Metric: The above process was not undergone to determine our original service level metric. Once we showed our work and conclusions, our senior management team was on board without much effort. In most organizations, a lot more work is required to make this change, and occasionally I’ve not been able to convince the organization to change at all.
Change Management: It took roughly six months to completely trade “service level” for “average speed of answer” in our lexicon and in all reports our leaders were pulling for themselves. Some of our smaller departments continued to measure themselves by service level much longer than expected. A wider inventory of reporting should have been collected and modified than what we pulled together initially. Additionally, more work on change management with those below the executive level was needed.
Priority Routing: A portion of our dealers (gallery) get priority routing so their calls are answered quicker than non-gallery dealers. The logic when we’re maintaining an 80/30 service level worked fine. When we moved to a 1-2 minute average speed of answer, the logic created a logjam where non-gallery dealers did not get their call answered until gallery dealers stopped calling us. We deployed an alternate routing method that delivered on our promise to gallery dealers without causing a logjam for non-gallery dealers.
Average Handle Time: A large portion of our agents were wrapping up their calls in available instead of after call wrap-up. Our average handle time went up by about a minute as we reduced availability. Our lift mentioned above was true, even with an increase in our average handle time.
Agent Fatigue: High occupancy brings agent fatigue, and agent fatigue leads to agents finding alternate ways to give themselves a breather or worse—increased absenteeism and attrition. We successfully mitigated this by deploying flexibility. See our article Improve Service Level, Shrink, and Attrition by Giving Agents What They Want for more on flexibility in contact centers.
Conclusion:
Like in the Disney example, we found another way to solve our problem. The demand for Hunter Douglas products increased significantly through the pandemic. We were faced with the need to heavily cut our average handle time, increase our FTE, or, in our case, find a new way to manage our business. By choosing to find a new way to manage our business, we saw no disruption to our experience metrics, increased our VoC, changed to a more achievable measure of success, and maintained our existing staff without needing to increase our budget.
Level Up Your Contact Center!
Vertical can help you implement an intelligent cloud contact center solution that delivers a variety of advanced analytics to identify the service level and experience level metrics that are just right for your unique call center. This data can tell you exactly how you’re doing and where you can make valuable improvements.
Vertical is the expert when it comes to designing a better communications strategy, whether it’s building a more effective contact center with an exceptional customer experience or taking your whole office to the cloud in this remote and hybrid work environment. We’ve helped hundreds of businesses implement industry-leading voice, messaging, and video solutions that enable employees to do their best work from anywhere.